ST_ISOVist
Signature
GEOMETRY ST_ISOVIST(GEOMETRY point, GEOMETRY obstacles,
	DOUBLE maxDistance)
GEOMETRY ST_ISOVIST(GEOMETRY point, GEOMETRY obstacles,
	DOUBLE maxDistance, DOUBLE angleStart, DOUBLE angleStop)
Description
This function compute the visibility polygon obstructed by provided obstacles.
Obstacles can be LINESTRING(S) ,POLYGON(S) or GEOMETRYCOLLECTION(S).
Resulting polygon will be enclosed by a circle defined by the maximum distance (maxDistance) parameter.
Parameters
point: Point coordinates (x, y, (z)) from which the visibility will be calculated,obstacles: Geometry or set of geometries grouped into a simple or complex geometry, used as obstacles,maxDistance: Only obstacles located within this distance from thepointare considered in the calculation (only cartesian distance is accepted - depends on your spatial ref),angleStart: Starting angle from which visibility will be calculated (exprimed in radian - to convert from degree, use the H2 database PI() function),angleStop: Ending angle from which visibility will be calculated (exprimed in radian).
Examples
Initialize input geometries
- point where the visibility will be computed :
pointlayer - buildings :
polygonlayer - walls :
linestringlayer - buildings and walls :
geomCollectionlayer
DROP TABLE IF EXISTS point, polygon, linestring, geomcollection;

CREATE TABLE point AS SELECT ST_GEOMFROMTEXT('POINT (28.20 59.11)') as the_geom;

CREATE TABLE polygon AS SELECT ST_GEOMFROMTEXT('
	MULTIPOLYGON (((87.1 39 0, 90.8 28.8 0, 80.8 25.3 0, 75.4 40.7 0, 83.1 43.5 0, 87.1 39 0)), ((70.3 67.2 0, 76.3 51.9 0, 79.2 53.1 0, 81.9 46.1 0, 75.3 43.6 0, 72.6 50.5 0, 68 48.6 0, 61.9 63.9 0, 70.3 67.2 0)), ((68 33.6 0, 64.8 32.5 0, 62.3 39 0, 69.1 41.4 0, 70.7 34.8 0, 68 33.6 0)), ((65.4 31.2 0, 69 21.9 0, 55.1 16.3 0, 51.5 25.7 0, 65.4 31.2 0)), ((59.6 85.6 0, 63.4 75.6 0, 54.8 72.5 0, 51.1 82.2 0, 59.6 85.6 0)),
  ((62 38.3 0, 62.9 36.1 0, 58.8 34.5 0, 57.9 36.7 0, 62 38.3 0)), ((40.4 95.4 0, 39.7 95.3 0, 38.1 99.4 0, 49.1 103.4 0, 55.8 87.4 0, 32.5 78 0, 30.4 82.9 0, 43.3 88 0, 40.4 95.4 0)), ((43.5 64.9 0, 52.2 46.1 0, 50.4 45.3 0, 51.2 43.1 0, 48.7 42.2 0, 46.4 48.5 0, 45.7 48.2 0, 38.7 63.1 0, 43.5 64.9 0)), ((47.2 33.7 0, 49 29.1 0, 46.3 28 0, 44.4 32.8 0, 47.2 33.7 0)), ((25 19.9 0, 28.3 21 0, 28.8 19.1 0, 32.2 20.2 0, 32.8 18.6 0, 43.3 22.1 0, 46.2 13.3 0, 42.6 11.9 0, 42.1 12.9 0, 38.5 11.7 0, 38.6 11 0, 35.5 9.9 0, 35.9 8.8 0, 29.4 7.3 0, 25 19.9 0)), ((43 52.2 0, 44.6 48.4 0, 41.2 47.2 0, 38 47 0, 36.9 49.7 0, 43 52.2 0)),
  ((24.7 25.6 0, 20.7 37.5 0, 28.3 40.3 0, 31.3 31.5 0, 33.2 32.3 0, 34.4 29.2 0, 24.7 25.6 0)), ((18.2 83.9 0, 16.4 88.4 0, 26.3 92.5 0, 30.1 83.5 0, 16.5 78.2 0, 14.7 82.5 0, 18.2 83.9 0)), ((11.3 21 0, 10 24.9 0, 15.7 27.1 0, 17.2 23 0, 22.6 24.9 0, 23.7 22 0, 20 20.8 0, 19.6 22 0, 17.6 21.4 0, 17 22.9 0, 11.3 21 0)), ((19.3 19.9 0, 21.5 10.5 0, 8.2 7.3 0, 7.2 11.8 0, 9.3 12.3 0, 7.8 19.4 0, 16.1 21.1 0, 18.1 21.2 0, 18.5 19.7 0, 19.3 19.9 0)), ((8.3 64 0, 4.6 74.2 0, 13.8 77.7 0, 17.7 67.4 0, 14.8 66.4 0, 18.7 56 0, 12.2 53.4 0, 8.3 64 0)), ((14 50.8 0, 14.9 48.4 0, 9.6 46.6 0, 12.1 39.1 0, 6 36.9 0, 2.7 46.9 0, 14 50.8 0)))') as the_geom;

CREATE TABLE linestring AS SELECT ST_GEOMFROMTEXT('
	MULTILINESTRING ((54.8 72.5 0, 51.1 82.2 0), (51.1 82.2 0, 59.6 85.6 0),
	(55.8 87.4 0, 32.5 78 0), (32.5 78 0, 30.4 82.9 0), (45.7 48.2 0, 38.7 63.1 0),
	(38.7 63.1 0, 43.5 64.9 0), (20.7 37.5 0, 28.3 40.3 0), (30.1 83.5 0, 16.5 78.2 0),
	(13.8 77.7 0, 17.7 67.4 0), (14.9 48.4 0, 9.6 46.6 0), (9.6 46.6 0, 12.1 39.1 0))') as the_geom;

CREATE TABLE geomcollection AS SELECT ST_GEOMFROMTEXT('GEOMETRYCOLLECTION(
	MULTIPOLYGON (((87.1 39 0, 90.8 28.8 0, 80.8 25.3 0, 75.4 40.7 0, 83.1 43.5 0, 87.1 39 0)),
	((70.3 67.2 0, 76.3 51.9 0, 79.2 53.1 0, 81.9 46.1 0, 75.3 43.6 0, 72.6 50.5 0, 68 48.6 0, 61.9 63.9 0, 70.3 67.2 0)),
	((68 33.6 0, 64.8 32.5 0, 62.3 39 0, 69.1 41.4 0, 70.7 34.8 0, 68 33.6 0)),
	((65.4 31.2 0, 69 21.9 0, 55.1 16.3 0, 51.5 25.7 0, 65.4 31.2 0)),
	((59.6 85.6 0, 63.4 75.6 0, 54.8 72.5 0, 51.1 82.2 0, 59.6 85.6 0)),
	((62 38.3 0, 62.9 36.1 0, 58.8 34.5 0, 57.9 36.7 0, 62 38.3 0))),
	MULTILINESTRING ((55.8 87.4 0, 32.5 78 0), (32.5 78 0, 30.4 82.9 0), (45.7 48.2 0, 38.7 63.1 0),
	(13.8 77.7 0, 17.7 67.4 0), (14.9 48.4 0, 9.6 46.6 0), (9.6 46.6 0, 12.1 39.1 0)))') as the_geom;
Example with a distance
Using polygon
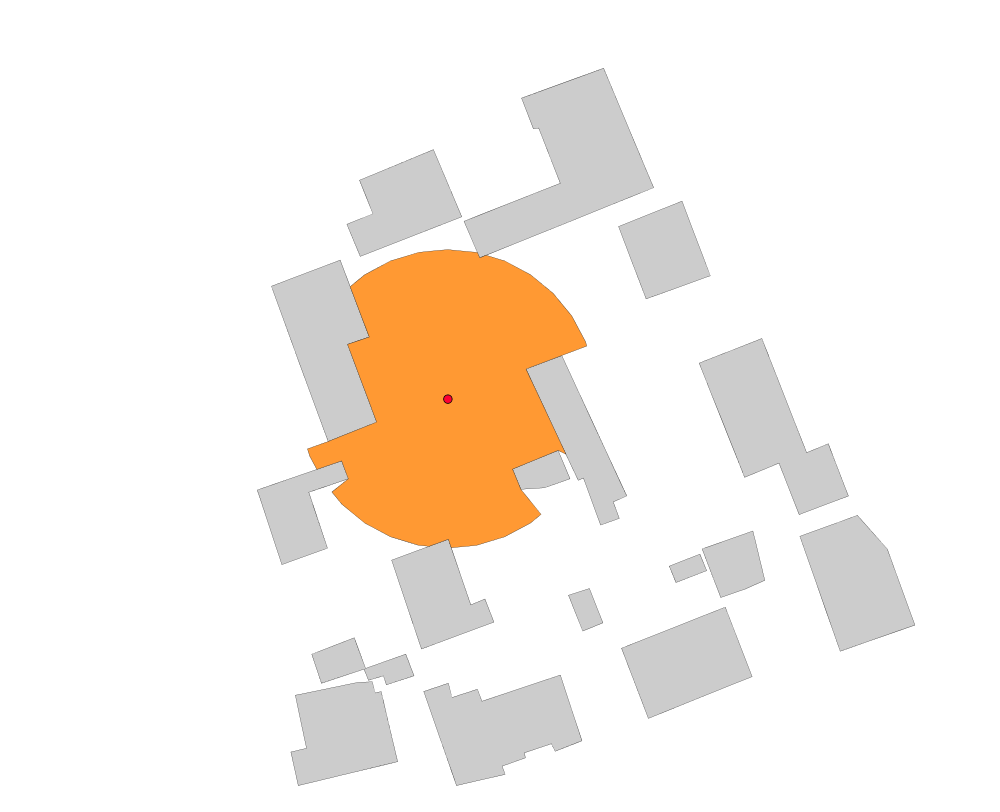
Use buildings (polygon) to compute the visibility from the point with a distance of 20m.
DROP TABLE IF EXISTS isovist;
CREATE TABLE isovist AS
  SELECT ST_ISOVIST(a.the_geom, b.the_geom, 20) as the_geom
  FROM point a, polygon b;
Result
Legend : polygon in grey / point in red / resulting ISOVist layer in orange
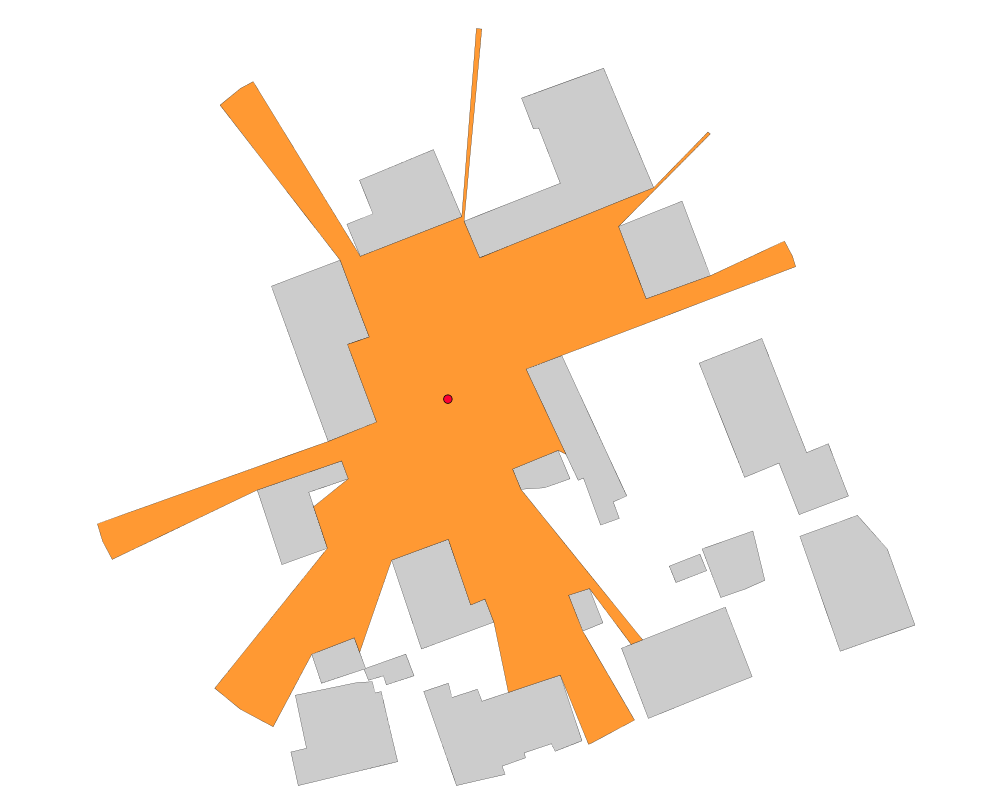
Same but with a distance of 50m.
DROP TABLE IF EXISTS isovist;
CREATE TABLE isovist AS
  SELECT ST_ISOVIST(a.the_geom, b.the_geom, 50) as the_geom
  FROM point a, polygon b;
Result
Legend : polygon in grey / point in red / resulting ISOVist layer in orange
Using linestring
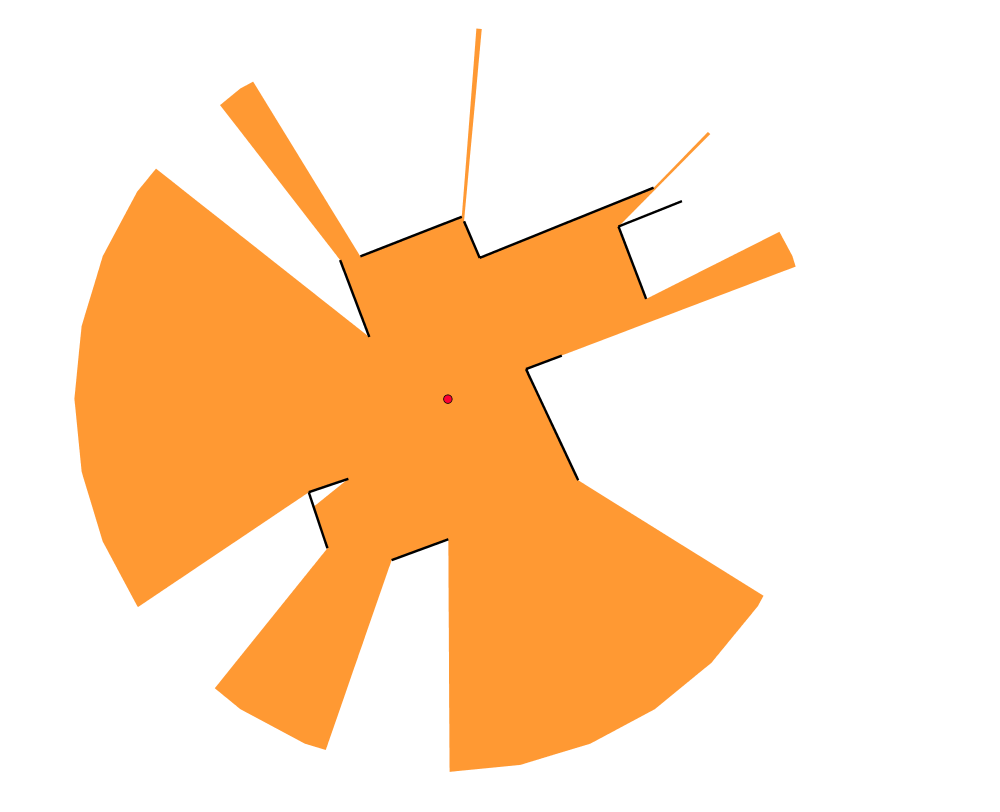
Use walls (linestring) to compute the visibility from the point with a distance of 50m.
DROP TABLE IF EXISTS isovist;
CREATE TABLE isovist AS
  SELECT ST_ISOVIST(a.the_geom, b.the_geom, 50) as the_geom
  FROM point a, linestring b;
Result
Legend : walls in black / point in red / resulting ISOVist layer in orange
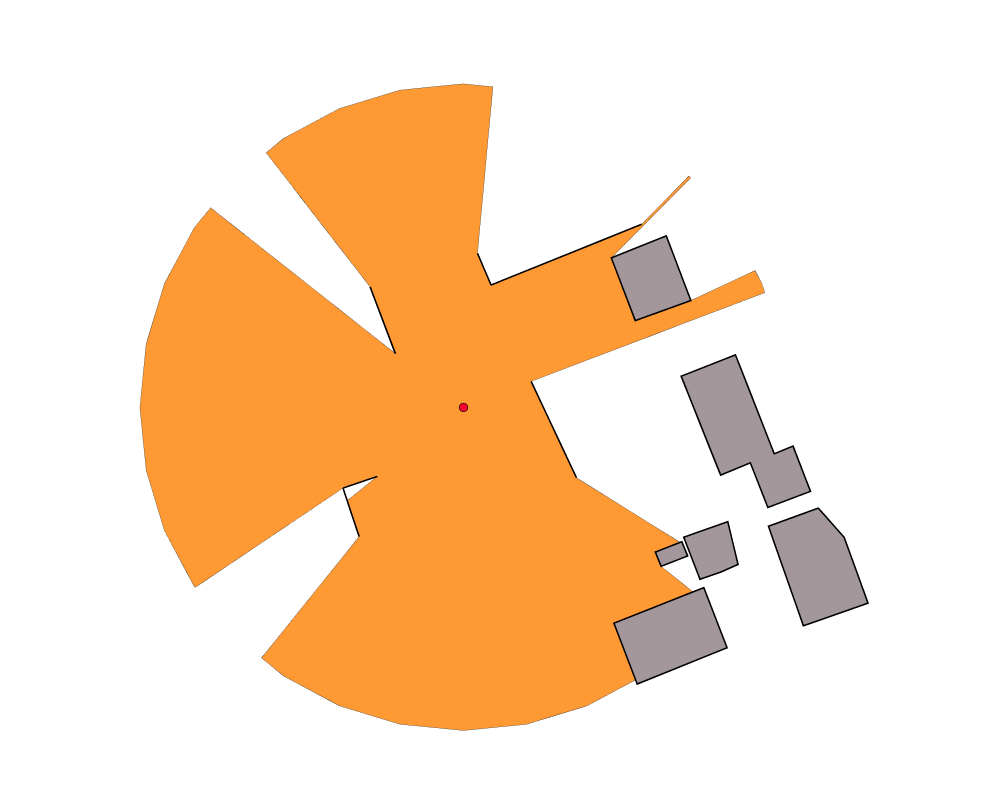
Using geomCollection
DROP TABLE IF EXISTS isovist;
CREATE TABLE isovist AS
  SELECT ST_ISOVIST(a.the_geom, b.the_geom, 50) as the_geom
  FROM point a, geomcollection b;
Result
Legend : polygon in grey / walls in black / point in red / resulting ISOVist layer in orange
Example with starting and ending angles
Compute the visibility using buildings (poygon layer) with a distance of 50m, starting at 0 rad and ending at 3 rad.
DROP TABLE IF EXISTS isovist;
CREATE TABLE isovist AS
  SELECT ST_ISOVIST(a.the_geom, b.the_geom, 50, 0, 3) as the_geom
  FROM point a, polygon b;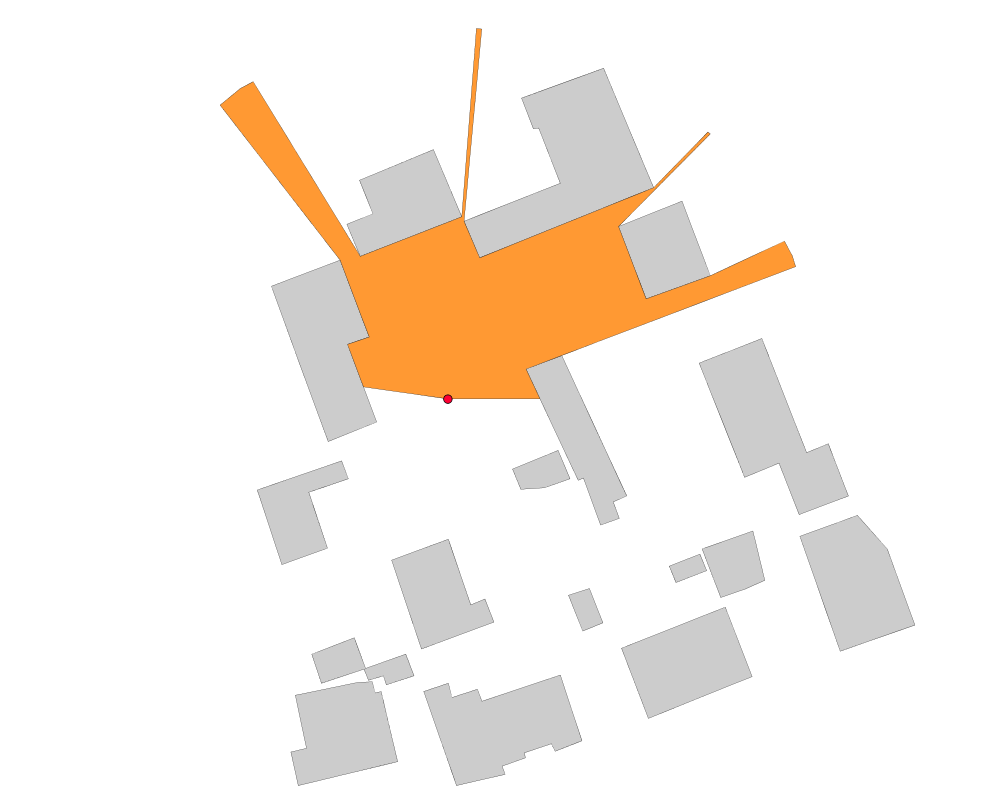
Same, but ending at 5 rad.
DROP TABLE IF EXISTS isovist;
CREATE TABLE isovist AS
  SELECT ST_ISOVIST(a.the_geom, b.the_geom, 50, 0, 5) as the_geom
  FROM point a, polygon b;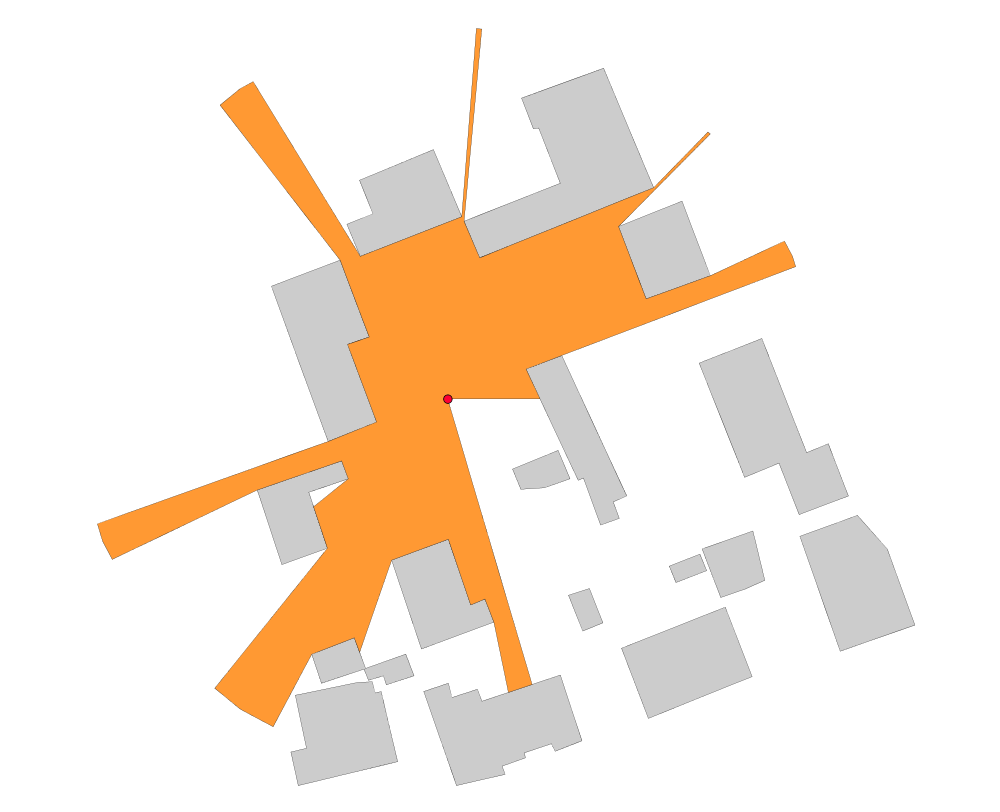
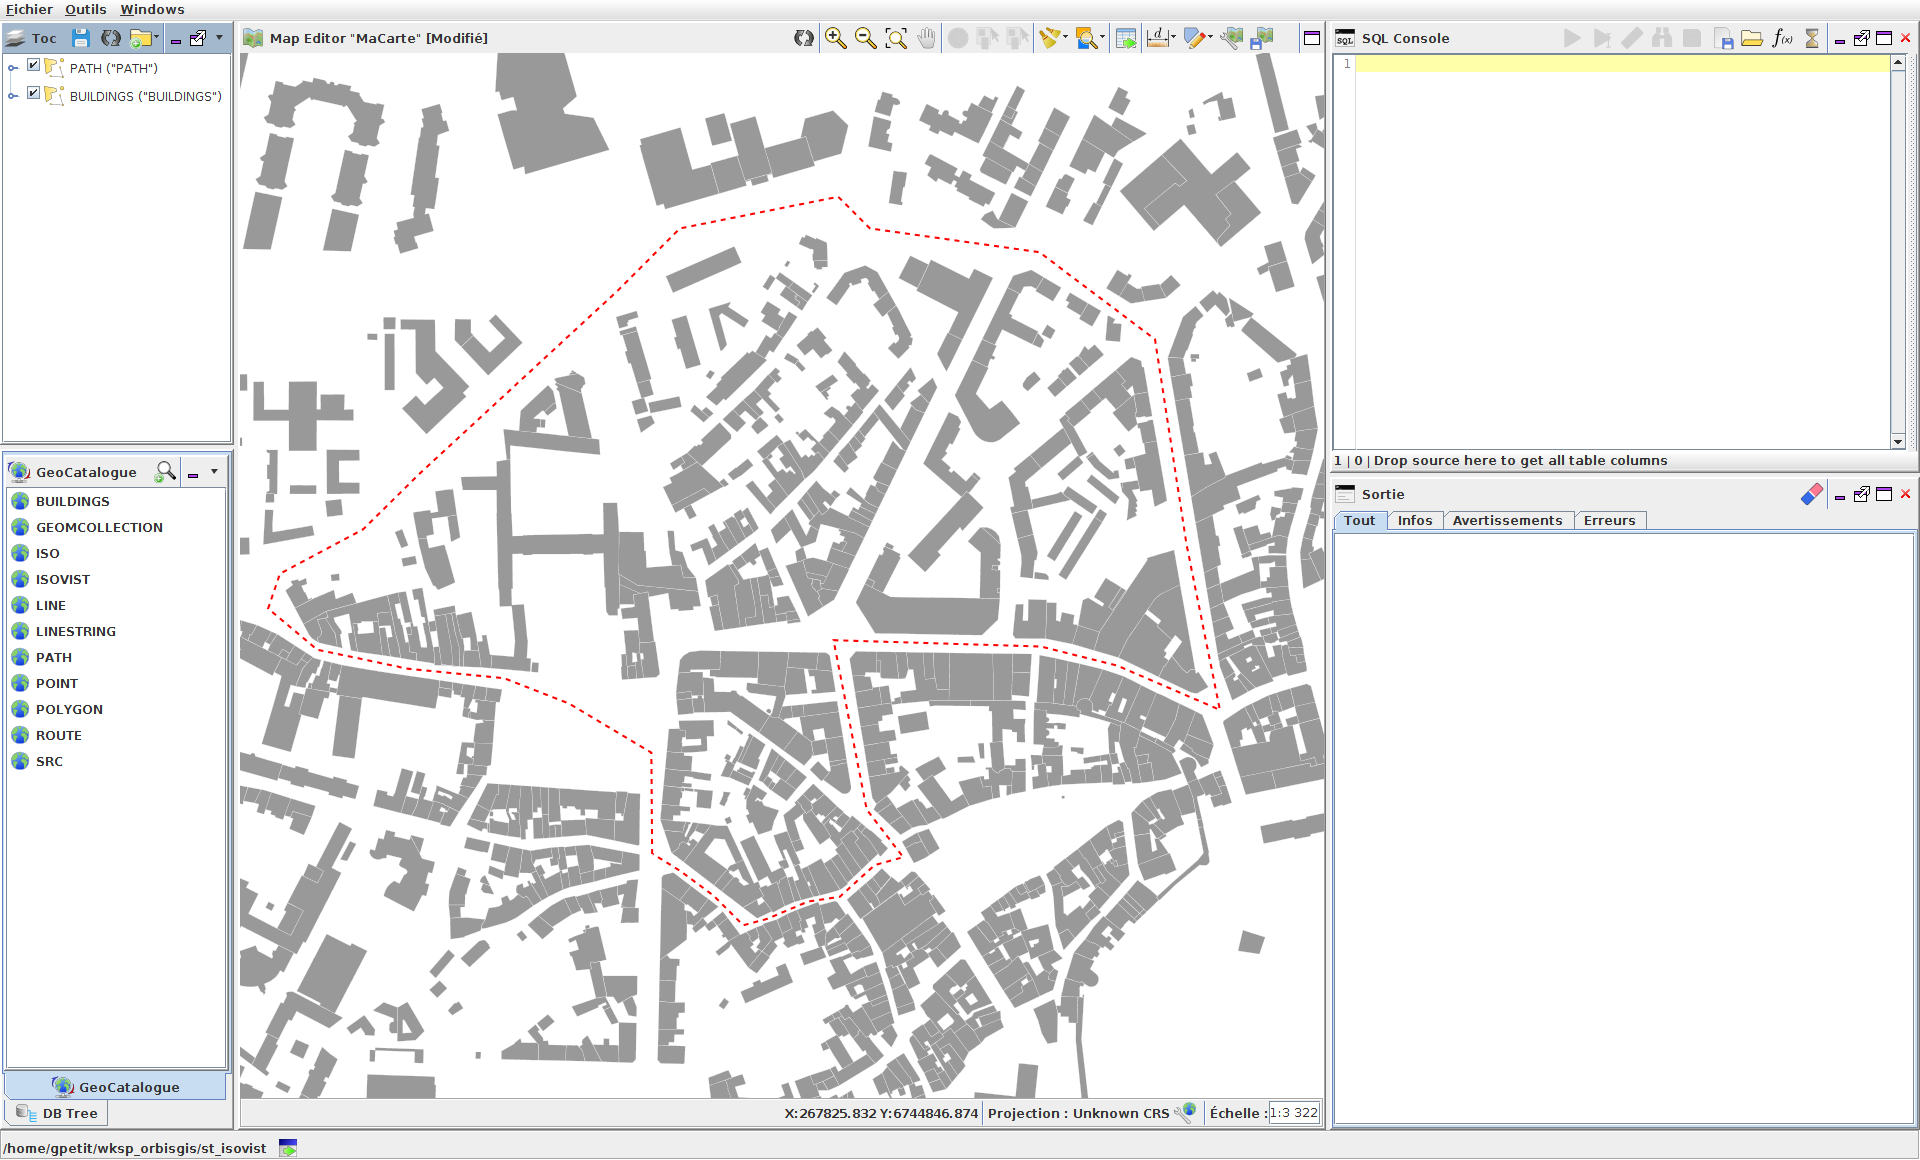
Application : Compute visibility along a path
Aim
Compute visibilities in the city center of Vannes (France), every 10m, with a 100m maximum distance of visibility and export results into an animated .gif file.
Cool isn’t it? Thanks to H2GIS, OrbisGIS, Groovy and The Gimp (all free and open-source) you will see that it’s quite easy to reproduce.
How to produce this animation?
To do so, just follow these steps:
- 1- Prepare input data
- 2- Run the Groovy script
- 3- Convert all the images into an animated .gif
1- Prepare input data
In this example, only two tables are needed:
buildings: a set ofpolygons(grey in the gif)path: alinestring. If you want to do a loop (like in the .gif), yourlinestringhas to be closed (red in the gif).
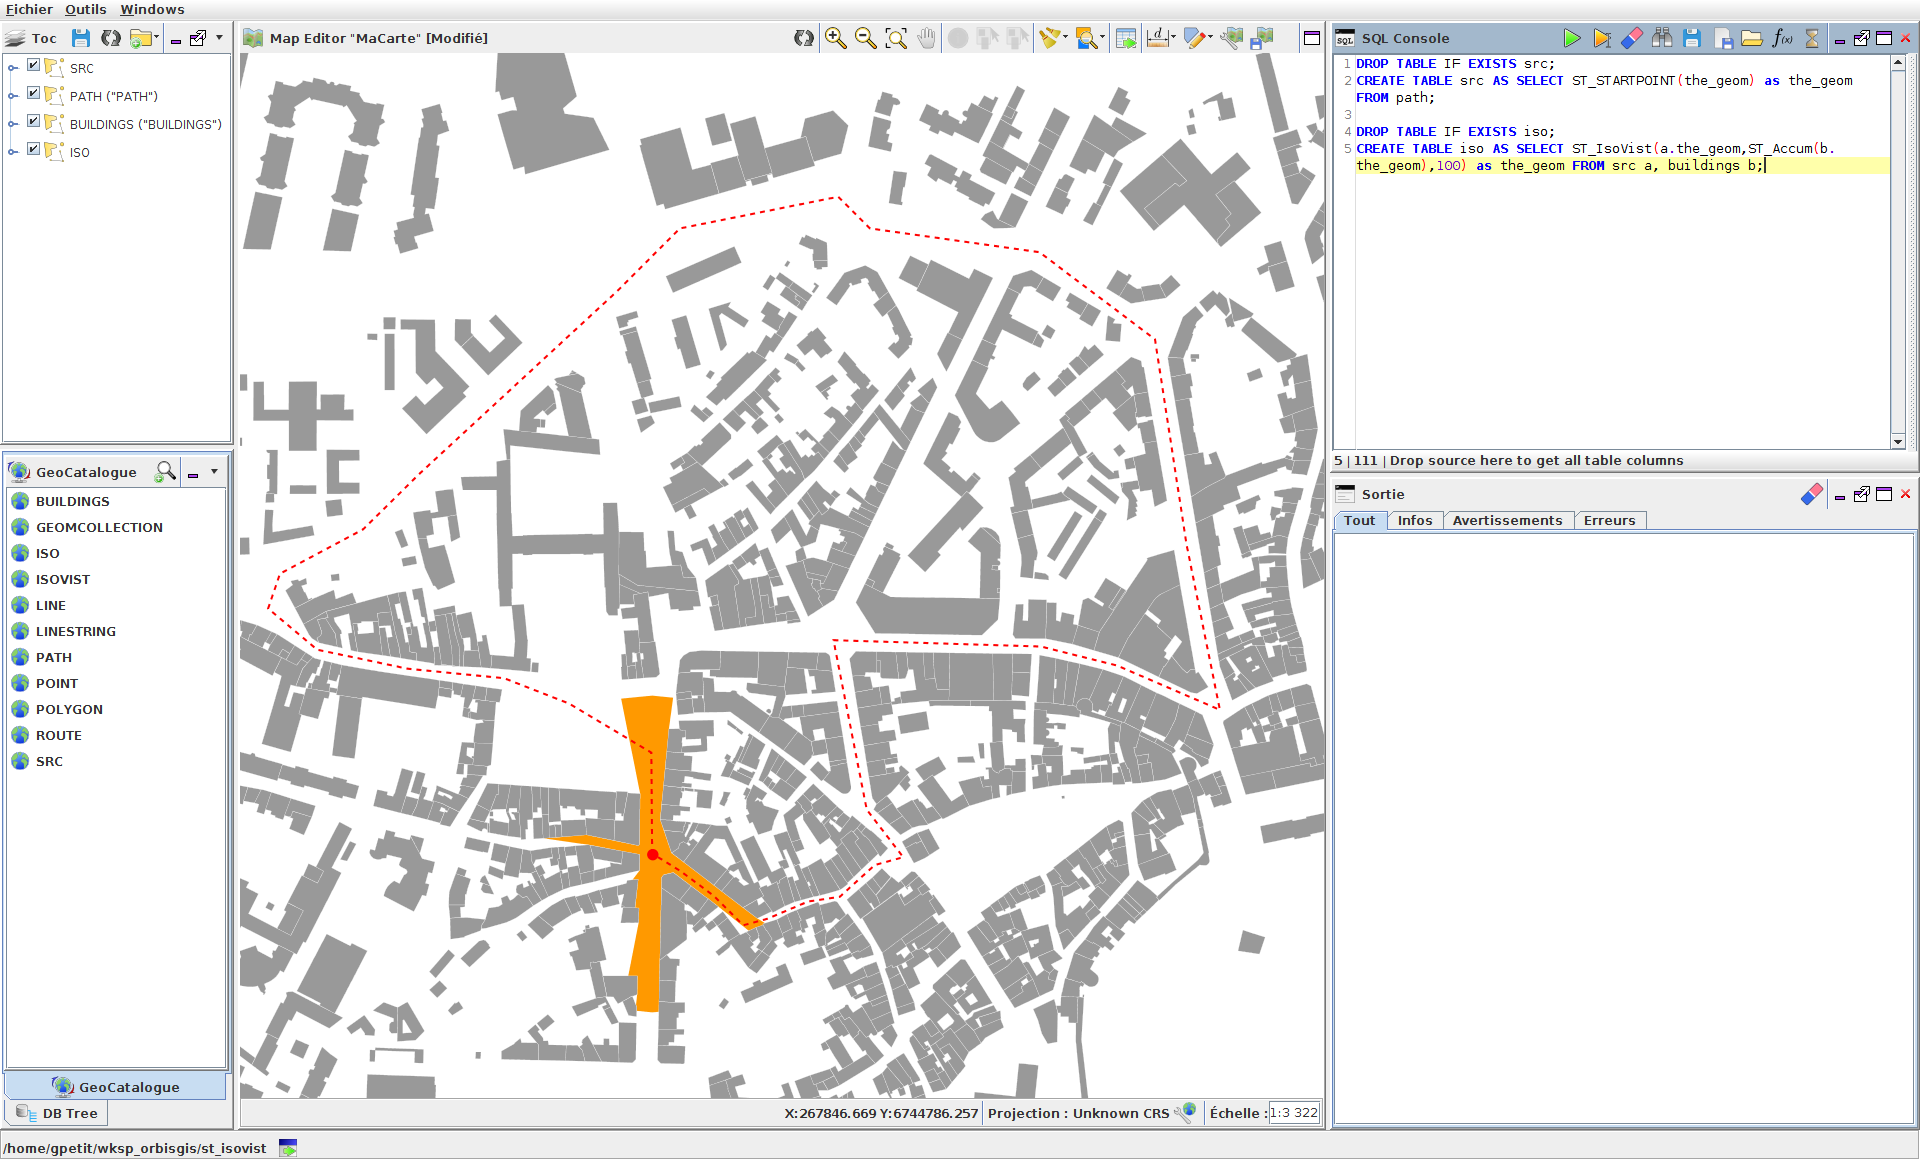
Load your data into OrbisGIS
In the SQL Console, execute the following script.
DROP TABLE IF EXISTS src, iso;

CREATE TABLE src AS
  SELECT ST_STARTPOINT(the_geom) as the_geom
  FROM path;

CREATE TABLE iso AS
  SELECT ST_IsoVist(a.the_geom, ST_Accum(b.the_geom), 100) as the_geom
  FROM src a, buildings b;
Where ST_IsoVist(a.the_geom, ST_Accum(b.the_geom), 100) → 100 is the maxDistance value used in this example.
This script will creates:
- the first (starting) point of your
path(srclayer), - the ISOVist (
isolayer) from the first point.
Once executed, load src and iso layers into the TOC and adapt their styles to fit to your needs (here red point and orange polygon).
2- Run the Groovy script
In the OrbisGIS’s Groovy Console, execute the script presented below.
In a nutshell, this script will:
- densify the path in order to obtain a set of points that will be used to compute visibilities,
- for each point, compute the visibility and export the map into a .png file.
import org.orbisgis.core_export.MapImageWriter;
import java.awt.Color;

MapImageWriter mapImageWriter = new MapImageWriter(mc.getLayerModel());
mapImageWriter.setPixelSize(MapImageWriter.MILLIMETERS_BY_INCH / 72);
mapImageWriter.setFormat(MapImageWriter.Format.PNG);
mapImageWriter.setBoundingBox(mc.getBoundingBox());
mapImageWriter.setWidth(729);
mapImageWriter.setHeight(513);
mapImageWriter.setBackgroundColor(Color.WHITE);

for(int i=1;i<=256;i+=1) {
 sql.execute '''
  DROP TABLE IF EXISTS src;
  CREATE TABLE src AS SELECT ST_PointN(ST_Densify(the_geom, 10), '''+i+''') the_geom FROM path;
  DROP TABLE IF EXISTS iso;
  CREATE TABLE iso AS SELECT ST_IsoVist((SELECT ST_PointN(ST_Densify(the_geom, 10), '''+i+''') the_geom FROM path), ST_Accum(the_geom), 100) the_geom FROM buildings;'''

 FileOutputStream fileOutputStream = new FileOutputStream("/myUrl/"+"test"+i+".png");
 mapImageWriter.write(fileOutputStream, null);
 fileOutputStream.close();
}
Where
mapImageWriter.setWidth(729)andsetHeight(513)defines the size (in pixels) of the output .png files,for(int i=1;i<=256;i+=1)→256correspond to the maximum number of image produced (so here the maximum number of point used to compute the visibility along thepath),ST_Densify(the_geom, 10)→10is the distance (exprimed in meter) used to densify thepath→ every10m a point will be added,pathis the layer name of the linestring used to computes visibilities,ST_Accum(the_geom), 100)→100is the maximum distance used to compute the visibilty (seemaxDistanceparameter),buildingsis the layer name in which obstacles are stored,/myUrl/+"test"+i+".png"→ .png files, prefixed bytest; will be saved into a folder defined by/myUrl/.srcandisoare respectively the output table names for the point where the visibility is calculated and the resulting visibility polygon.
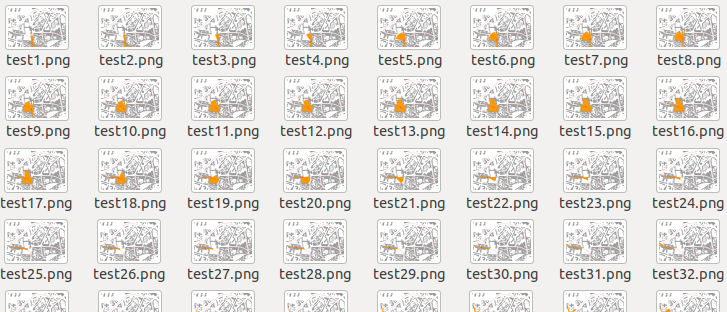
3- Convert all the images into an animated gif
Once the script ran, you obtain many .png files (in this example we have 200 files).
To convert them into an animated .gif file, follow these steps:
- Launch The Gimp,
- In the
Filemenu, “Open” the first image (heretest1.png), - In the
Filemenu, choose “Open as layers” and load the rest of images (here fromtest2.pngtotest200.png),
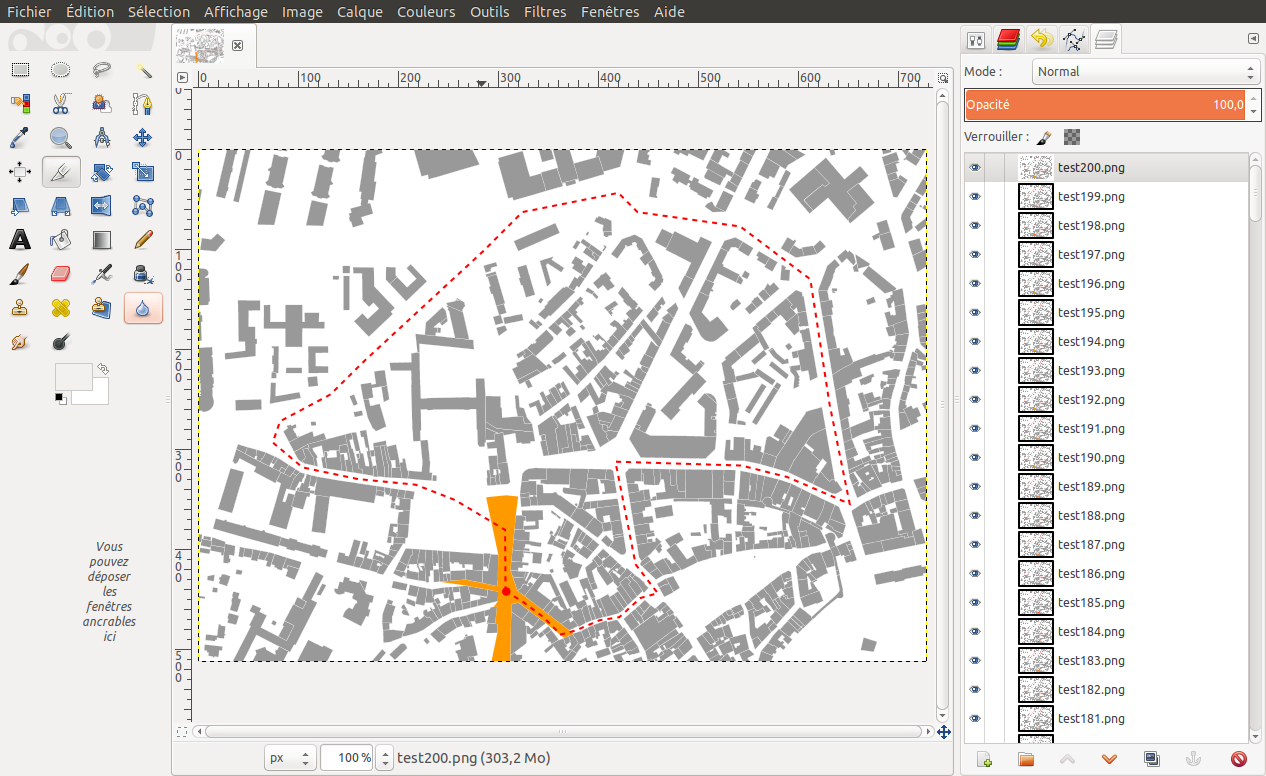
- Optionnaly, optimized the rendering for animation →
Filters→Animation→Optimize (for GIF), - Export the result :
File→Èxport as→ choose the.giffile format and specify the file name and output folder →Export, - In the configuration panel, choose
Save as animationand you can specify the time between images (by default 100ms) →Export
Your animated .gif file is produced !